Warning: Creating default object from empty value in /var/www/wp-content/themes/ronneby/redux_framework/ReduxCore/inc/class.redux_filesystem.php on line 29
Evolution Bioscience | Therapeutic IPO Tracker: A Data Visualisation by Evolution Bioscience
Notice: Function WP_Scripts::localize was called incorrectly. The $l10n parameter must be an array. To pass arbitrary data to scripts, use the wp_add_inline_script() function instead. Please see Debugging in WordPress for more information. (This message was added in version 5.7.0.) in /var/www/wp-includes/functions.php on line 6078
';

Therapeutic IPO Tracker: A Data Visualisation by Evolution Bioscience

Global Drug Development & Therapeutic IPO Tracker

A Data Visualisation by Evolution Bioscience

delimiter image

Evolution Global have launched a Therapeutic IPO Data Visualisation, compiling global market intelligence from 2012 onwards in order to evaluate the historical trends in drug development and commercialisation. Our analysis features over 502 unique companies as of the end of 2018, outlining therapeutic targets, treatment types, financial figures, clinical trial status, treatment scale and company details for each publicly listed corporation.

Evolution’s Therapeutic IPO Tracker is responsive and interactive, enabling analysts and investors to identify trends and patterns within the biopharmaceutical industry. Users can click on any element of the data visualisation, and the charts will update to filter the data. Due to the volume of information included, this data visualisation is best viewed on larger screens.

AS FEATURED IN

Genetic Engineering & Biotechnology News
Forbes

BUSINESS BENEFITS

How will our IPO Tracker help your business?

  • Investment Intelligence
    Actionable Analytics & Interactive Trend Analysis

    For Investors and Venture Capital Firms, our IPO Tracker provides interactive, in-depth intelligence & analytics to enable informed decision making and maximise your ROI.

  • Business Development
    Strategy Formulation & Business Prospecting Tool

    For Biotech, Biopharma and Pharmaceutical professionals, our IPO Tracker gives you a strategic advantage by providing an evidence-based visual landscape of your competitors and potential Business Development prospects.

  • Mergers & Acquisitions
    Global M&A Activity Targeting

    For Corporate & Executive level professionals, our IPO Tracker provides invaluable empirical intelligence. Our advanced filters enable you to analyse global developments in the industry based on types of treatments, disease indications, lead product status, IPO market geographies and Company locations.

FIRST TIME USING A DATA VISUALISATION?

How to get the most out of our IPO tracker

delimiter image

Users can click on any element of the data visualisation, and the charts will update to filter the data. You can select multiple elements on different charts in order to filter the data based on multiple criteria. To jump back to the full, unfiltered data, simply click on an empty white region of the chart.

Hovering over elements will provide you with more information. For example, hovering over a bubble chart will show you details about the Company.

Dropdown filters and selectors enable you to isolate specific treatment types, therapeutic targets, company locations and geographic IPO regions.

Our responsive Therapeutic IPO Tracker is split into six separate dashboards, as outlined below. You can jump from dashboard to dashboard by using the grey boxes at the top of the Data Visualisation.

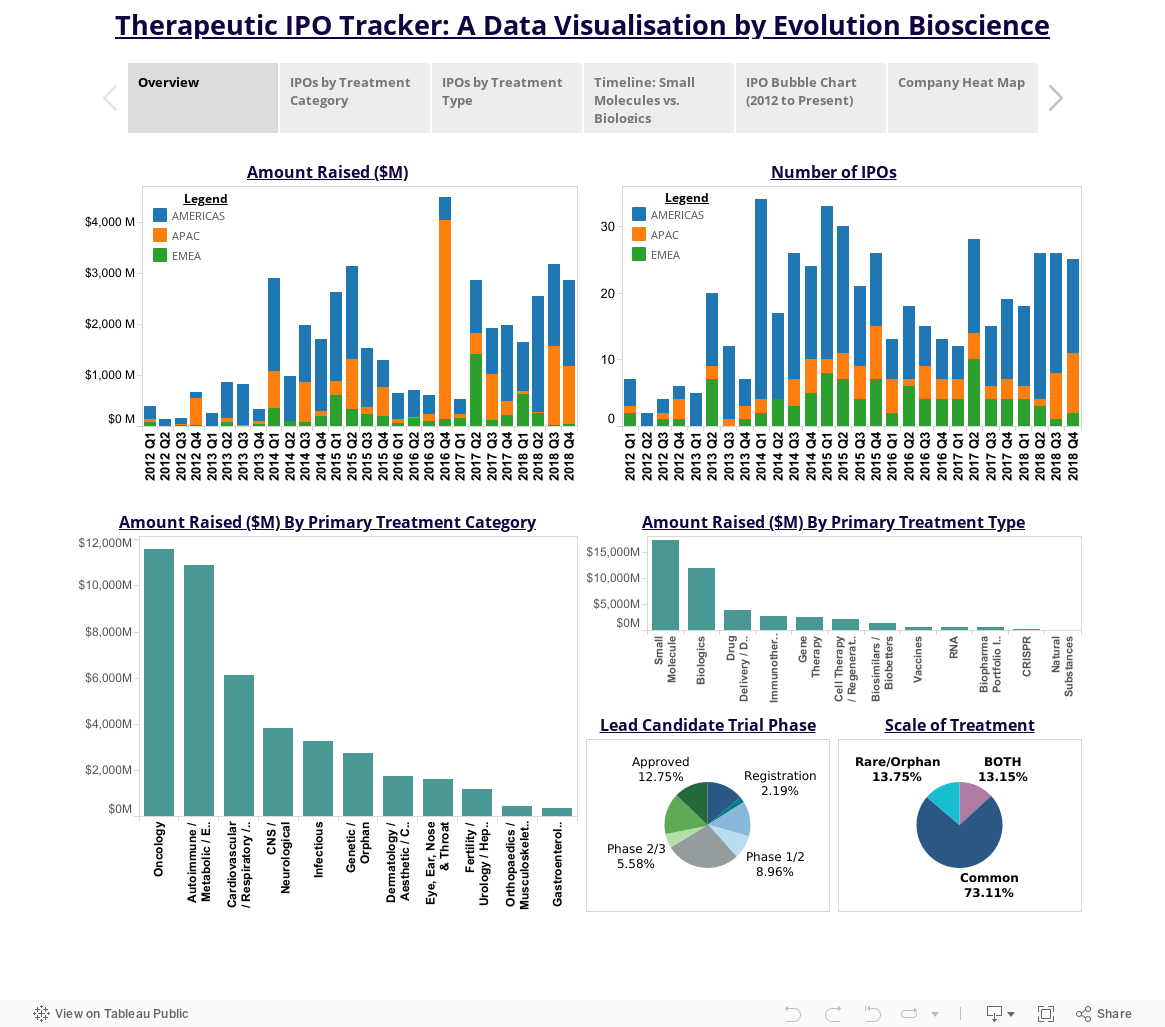
1. The “Overview” dashboard utilises quarterly IPO statistics to visualise the flow of money within the industry.

2. The “IPOs by Treatment Category” dashboard enables users to filter the data based on a Company’s Treatment Category, such as Autoimmune Diseases, Infectious Diseases, Oncology, etc.

3. The “IPOs by Treatment Type” dashboard enables users to filter the data based on the type of treatment of the Company’s Lead Product Candidate, such as Small Molecules, Biologics, Vaccines, etc.

4. The “Timeline: Small Molecules vs. Biologics” dashboard shows a timeline analysis of Therapeutic IPOs based on the Treatment Type of each Company’s Lead Candidate.

5. The “IPO Bubble Chart: 2012 to Present” shows each Company as an individual Bubble, sized based on the amount of capital raised during the initial public offering. You can filter the results based on the Scale of Treatment (Common, Rare/Orphan), Country of Incorporation, IPO Market Region and in which quarter the IPO occurred.

6. The “Company Heat Map” shows the geographic spread of funds raised by IPOs based on the country of incorporation. Results can be filtered by Market Region, IPO Date, Primary Treatment Type & Primary Disease Category.

This data visualisation and the underlying data is the property of Evolution Bioscience. If you’d like to use our data or embed our visualisation, please ensure that Evolution Bioscience is properly cited as the source, with a link back to this page. Please contact Evolution Bioscience via the contact form below for more information.

Evolution Global’s Therapeutic IPO Tracker will be updated on a quarterly basis.

If you have any questions or suggestions, please do not hesitate to contact us via the form below:

    Your Name (required)

    Your Email (required)

    Subject

    Your Message


    Notice: Trying to access array offset on value of type bool in /var/www/wp-content/themes/ronneby/inc/aq_resizer.php on line 101

    Notice: Trying to access array offset on value of type bool in /var/www/wp-content/themes/ronneby/inc/aq_resizer.php on line 102